
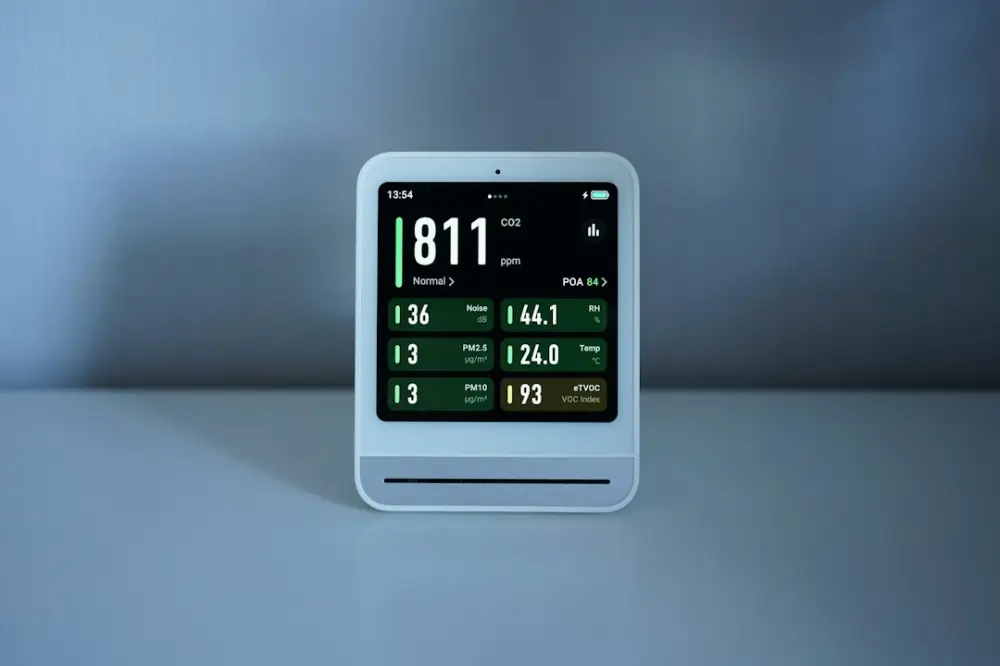
Evaluating everyday environmental choices involves using quantifiable metrics—such as carbon emissions, water consumption, and waste generation—to determine the ecological impact of personal habits. By moving beyond vague labels and using measurable criteria, individuals can make data-driven decisions that effectively reduce their environmental footprint and support broader sustainability goals throughout 2026.
In a dense urban setting, these metrics help residents distinguish between symbolic gestures and high-impact changes. Instead of guessing whether a product is truly sustainable, focusing on the lifecycle of materials and the energy intensity of services provides a clearer picture of one’s actual contribution to local environmental targets.
To move away from qualitative descriptions like "eco-friendly" or "green," we must look at Life Cycle Assessments (LCA). For example, when comparing a reusable cotton tote bag to a standard plastic carrier, a measurable criterion would be the number of times the tote must be used to offset the high energy and water intensity of its production. In 2026, data suggests this "break-even" point is significantly higher than many consumers assume, requiring hundreds of uses before the cotton bag becomes the superior environmental choice.
Essential Metrics for Everyday Sustainability
When assessing personal impact, three core metrics serve as the most reliable indicators: Carbon Dioxide Equivalent (CO2e), water footprint (liters), and waste diversion rates (percentage). CO2e is particularly useful because it bundles various greenhouse gases into a single, comparable figure, allowing you to weigh the impact of a cross-country train journey against a month of meat consumption.
Water footprints are equally critical, especially when considering the "embedded water" in consumer goods. A single pair of denim jeans may require thousands of liters of water to produce, a figure that is often overlooked in favor of carbon stats. By following a beginner’s guide to sustainable living, residents can begin to identify which categories of their spending hold the highest concentrations of these hidden costs.
Waste diversion metrics track how much of your household output is diverted from landfills through recycling or composting. In modern apartment blocks, this is often measured by volume or weight. Tracking these figures over a month provides a baseline to evaluate whether new habits, such as using a local food waste scheme, are actually moving the needle.
Evaluating Your Daily Carbon Footprint
Calculating your footprint doesn't require a degree in environmental science, but it does require consistent data collection. To get an accurate reading of your daily impact in 2026, follow these steps:
- Audit your utility data: Review your monthly energy bills to find your actual kWh usage. This is the most accurate way to improve energy efficiency in everyday spaces rather than relying on national averages.
- Log your transport mileage: Record the distance traveled by tube, bus, and rail. Use the UK Government GHG Conversion Factors to turn these distances into CO2e.
- Analyze food sourcing: Use a carbon calculator to estimate the impact of your diet. Focus on the frequency of high-impact imports versus seasonal, locally sourced produce.
- Review procurement: Look at the "last mile" delivery impact of online shopping. Consolidating orders into a single weekly delivery significantly reduces the per-item carbon cost.
By repeating this process quarterly, you can see the direct result of lifestyle adjustments, such as switching to a heat pump or opting for a cargo bike for local errands.
Data Privacy and Eco-Tracking Tools
As we rely more on digital tools to track our environmental impact, the intersection of sustainability and data privacy becomes a primary concern. Many carbon tracking apps require access to bank statements via Open Banking or location data to estimate transport emissions. While these tools provide highly specific insights, they also create a digital trail of your personal habits.
When choosing a tool in 2026, look for services that use anonymized data and offer clear opt-out clauses for third-party sharing. For example, some community-led energy monitors allow you to track your home’s peak usage hours locally on your device without uploading the data to a cloud server. Balancing the need for precision with personal privacy ensures that your journey toward a lower footprint remains secure.
Connecting Actions to Global Goals
Individual choices may feel small, but they are the building blocks for achieving international targets like the UN Sustainable Development Goals (SDGs). Specifically, Goal 12 focuses on responsible consumption and production. When a household chooses to repair an appliance rather than replace it, they are directly contributing to a reduction in global e-waste, which is projected to reach record highs if current trends continue through the late 2020s.
Measuring these actions allows for the aggregation of data across neighborhoods. If 500 households in a single postcode reduce their evening energy demand by 15%, the cumulative effect reduces the need for the National Grid to fire up carbon-intensive "peaker" plants. This scalability transforms a private household choice into a collective urban solution.
Categories for Environmental Assessment
To keep evaluations manageable, it helps to categorize your choices into three distinct buckets: high-frequency, high-impact, and long-term infrastructure.
- High-frequency choices: These are daily habits, such as coffee cup use, grocery packaging, and commuting methods. While the individual impact is low, the cumulative annual total is significant.
- High-impact choices: These occur less often but have a massive footprint, such as choosing between a domestic flight and a rail journey, or deciding whether to buy a new piece of furniture or source it second-hand.
- Infrastructure choices: These are one-off or rare decisions, such as installing secondary glazing, upgrading loft insulation, or switching to a green energy tariff. These choices "lock in" a lower footprint for years to come.
Focusing on infrastructure and high-impact choices typically yields the fastest reduction in your overall metrics, while high-frequency choices help maintain an awareness of resource consumption.
Local Impact: Greening the Kings Cross Community
Applying measurable criteria to our lives is particularly relevant for those living and working around the King’s Cross area. With the ongoing monitoring of air quality along the Euston Road and the development of the N1C district, the community has access to localized data that can inform personal choices. For instance, choosing to walk through the pedestrianized zones of the estate rather than along main arterial roads not only reduces your exposure to particulates but also supports the local shift toward a low-traffic neighborhood.
At Kings Cross Environment, we believe that sustainability is most effective when it is grounded in the reality of our specific urban landscape. By using the tools and metrics discussed here, residents can contribute to a more resilient local ecosystem. Whether you are tracking the success of a communal composting project or measuring the energy savings from a new apartment retrofitting initiative, your data-driven actions help shape the future of our neighborhood. This practical approach ensures that our collective efforts in 2026 result in tangible improvements for the air, water, and soil of the King’s Cross area.